Events
Event management is where you look at everything Microsoft 365 has logged for one tenant — sign-ins, admin actions, mailbox rule changes and the rest — graded by how much attention each one deserves. Come here to investigate something a client has reported, to check whether monitoring is working for a tenant, or to see which of your own event rules are hiding events from view.
Event management is one of two tabs on the Monitoring page; the other is Triage.
The Triage tab
Section titled “The Triage tab”Coming soon
This part of Octiga isn't built yet. Check back once it ships.
What is monitored
Section titled “What is monitored”Every event Octiga ingests is classified once, on arrival, into one of four grades:
- Critical
- Danger
- Warning
- Info — hidden by default; switch the lens to Everything to see it
Each event also carries the location it happened from, resolved to a country and, where Octiga can tell, the network operator behind the IP address (for example a named ISP or cloud provider).
Monitoring health
Section titled “Monitoring health”The beacon beside the page title tells you whether monitoring is working for this tenant: whether events are arriving at all, not whether any of them are a concern.
| State | What it means |
|---|---|
| Active | Events are arriving normally |
| Not subscribed | Reachable, but not yet subscribed to receive events |
| Audit log off | Microsoft’s own audit log is switched off for this tenant |
| Unreachable | Octiga can’t currently reach the tenant |
| Stale | There was a health check once, but nothing has refreshed it in a while — the check itself may have stopped |
| Disabled | Monitoring is deliberately switched off for this tenant. This is not an error |
| Pending | The tenant has just connected; the first health check hasn’t run yet |
Hover the beacon to see the reason and when it was last checked. If a tenant’s beacon isn’t Active and you don’t know why, see Troubleshooting.
The Event management screen
Section titled “The Event management screen”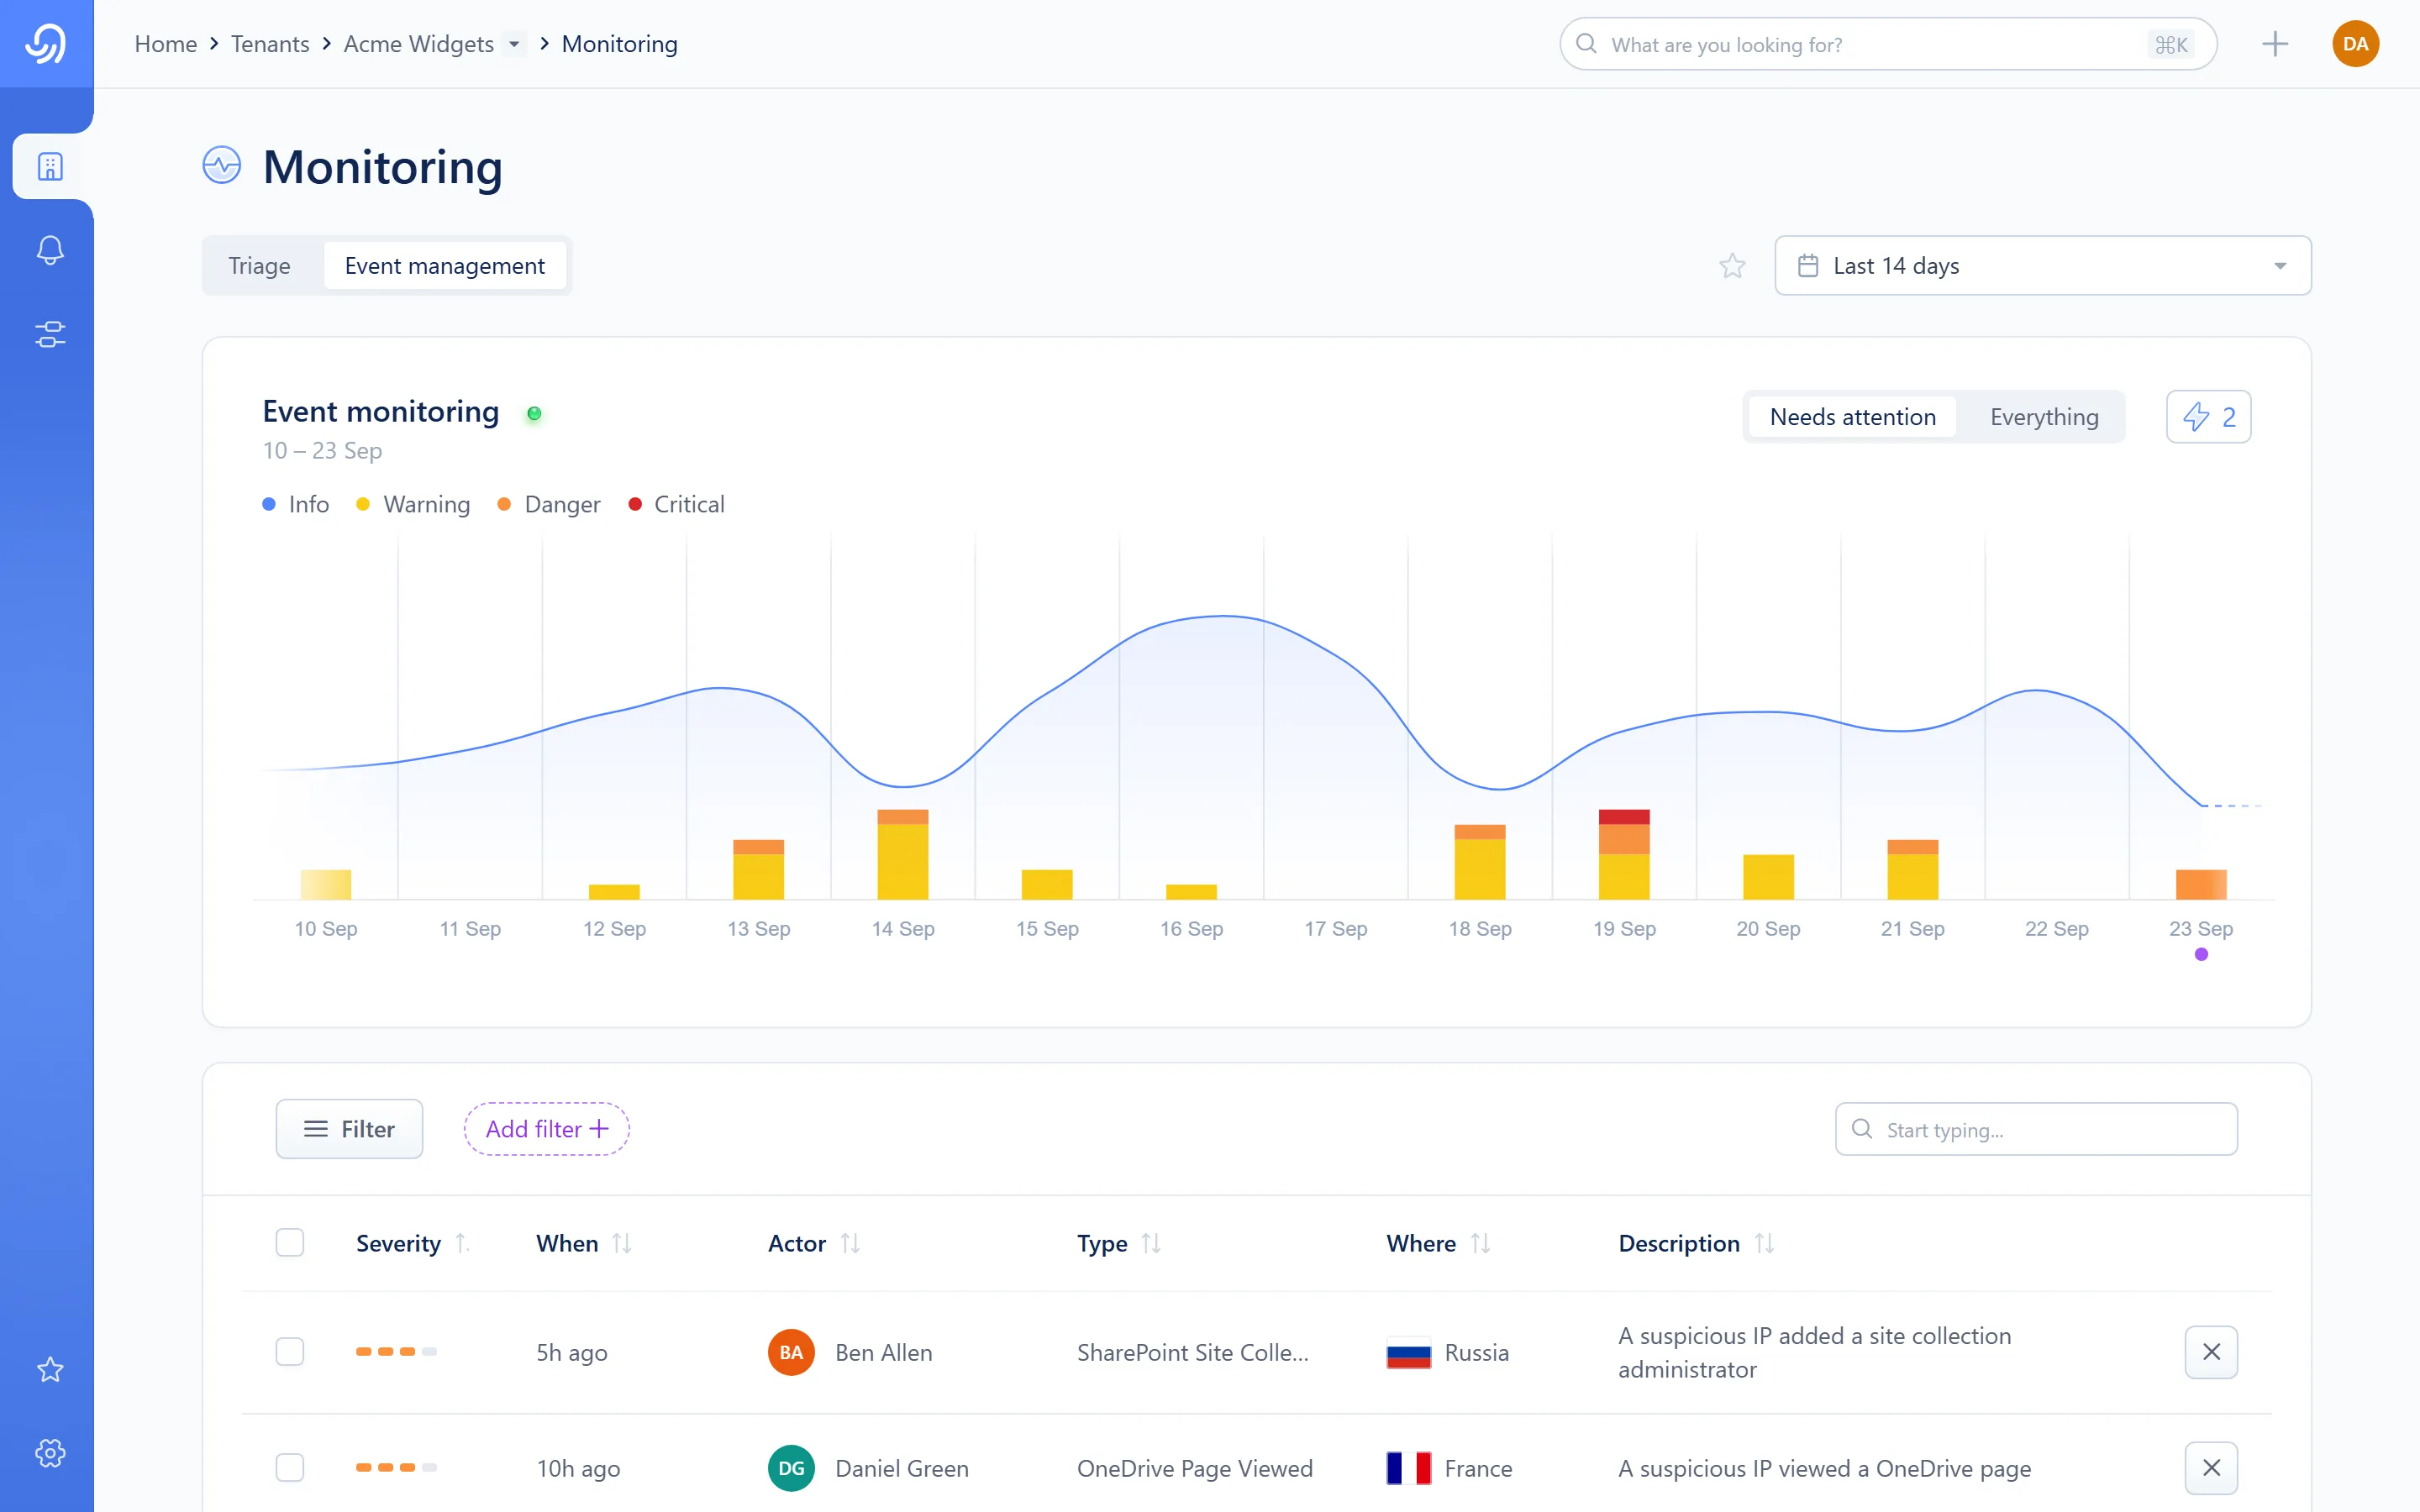
- Monitoring health beacon
- Lens — Needs attention or Everything
- Date range — past 7, 14 or 30 days
- Rules — how many of your event rules are currently hiding events from this view
- The events chart, one bar per day per grade
- Search
- The events table
The chart shows one stacked bar per day for the range you’ve chosen. It always includes info-grade events, whatever the lens is set to, so its shape stays put when you toggle the lens; only the table changes.
The lens — Needs attention shows warning grade and worse; Everything adds info and lets you reveal previously dismissed rows.
The table lists events with these columns: Severity, When, Actor, Type, Where, Description. Description wraps rather than truncating, so a longer entry makes its row taller. The When column shows a relative time such as “3 hours ago”; hover it for the exact timestamp. The list loads more rows as you scroll.
Rules — the count beside the date range tells you how many event rules matched something in the current window, and how many events each one hid. Select it to see them; see Event rules for what a rule does.
The filter drawer
Section titled “The filter drawer”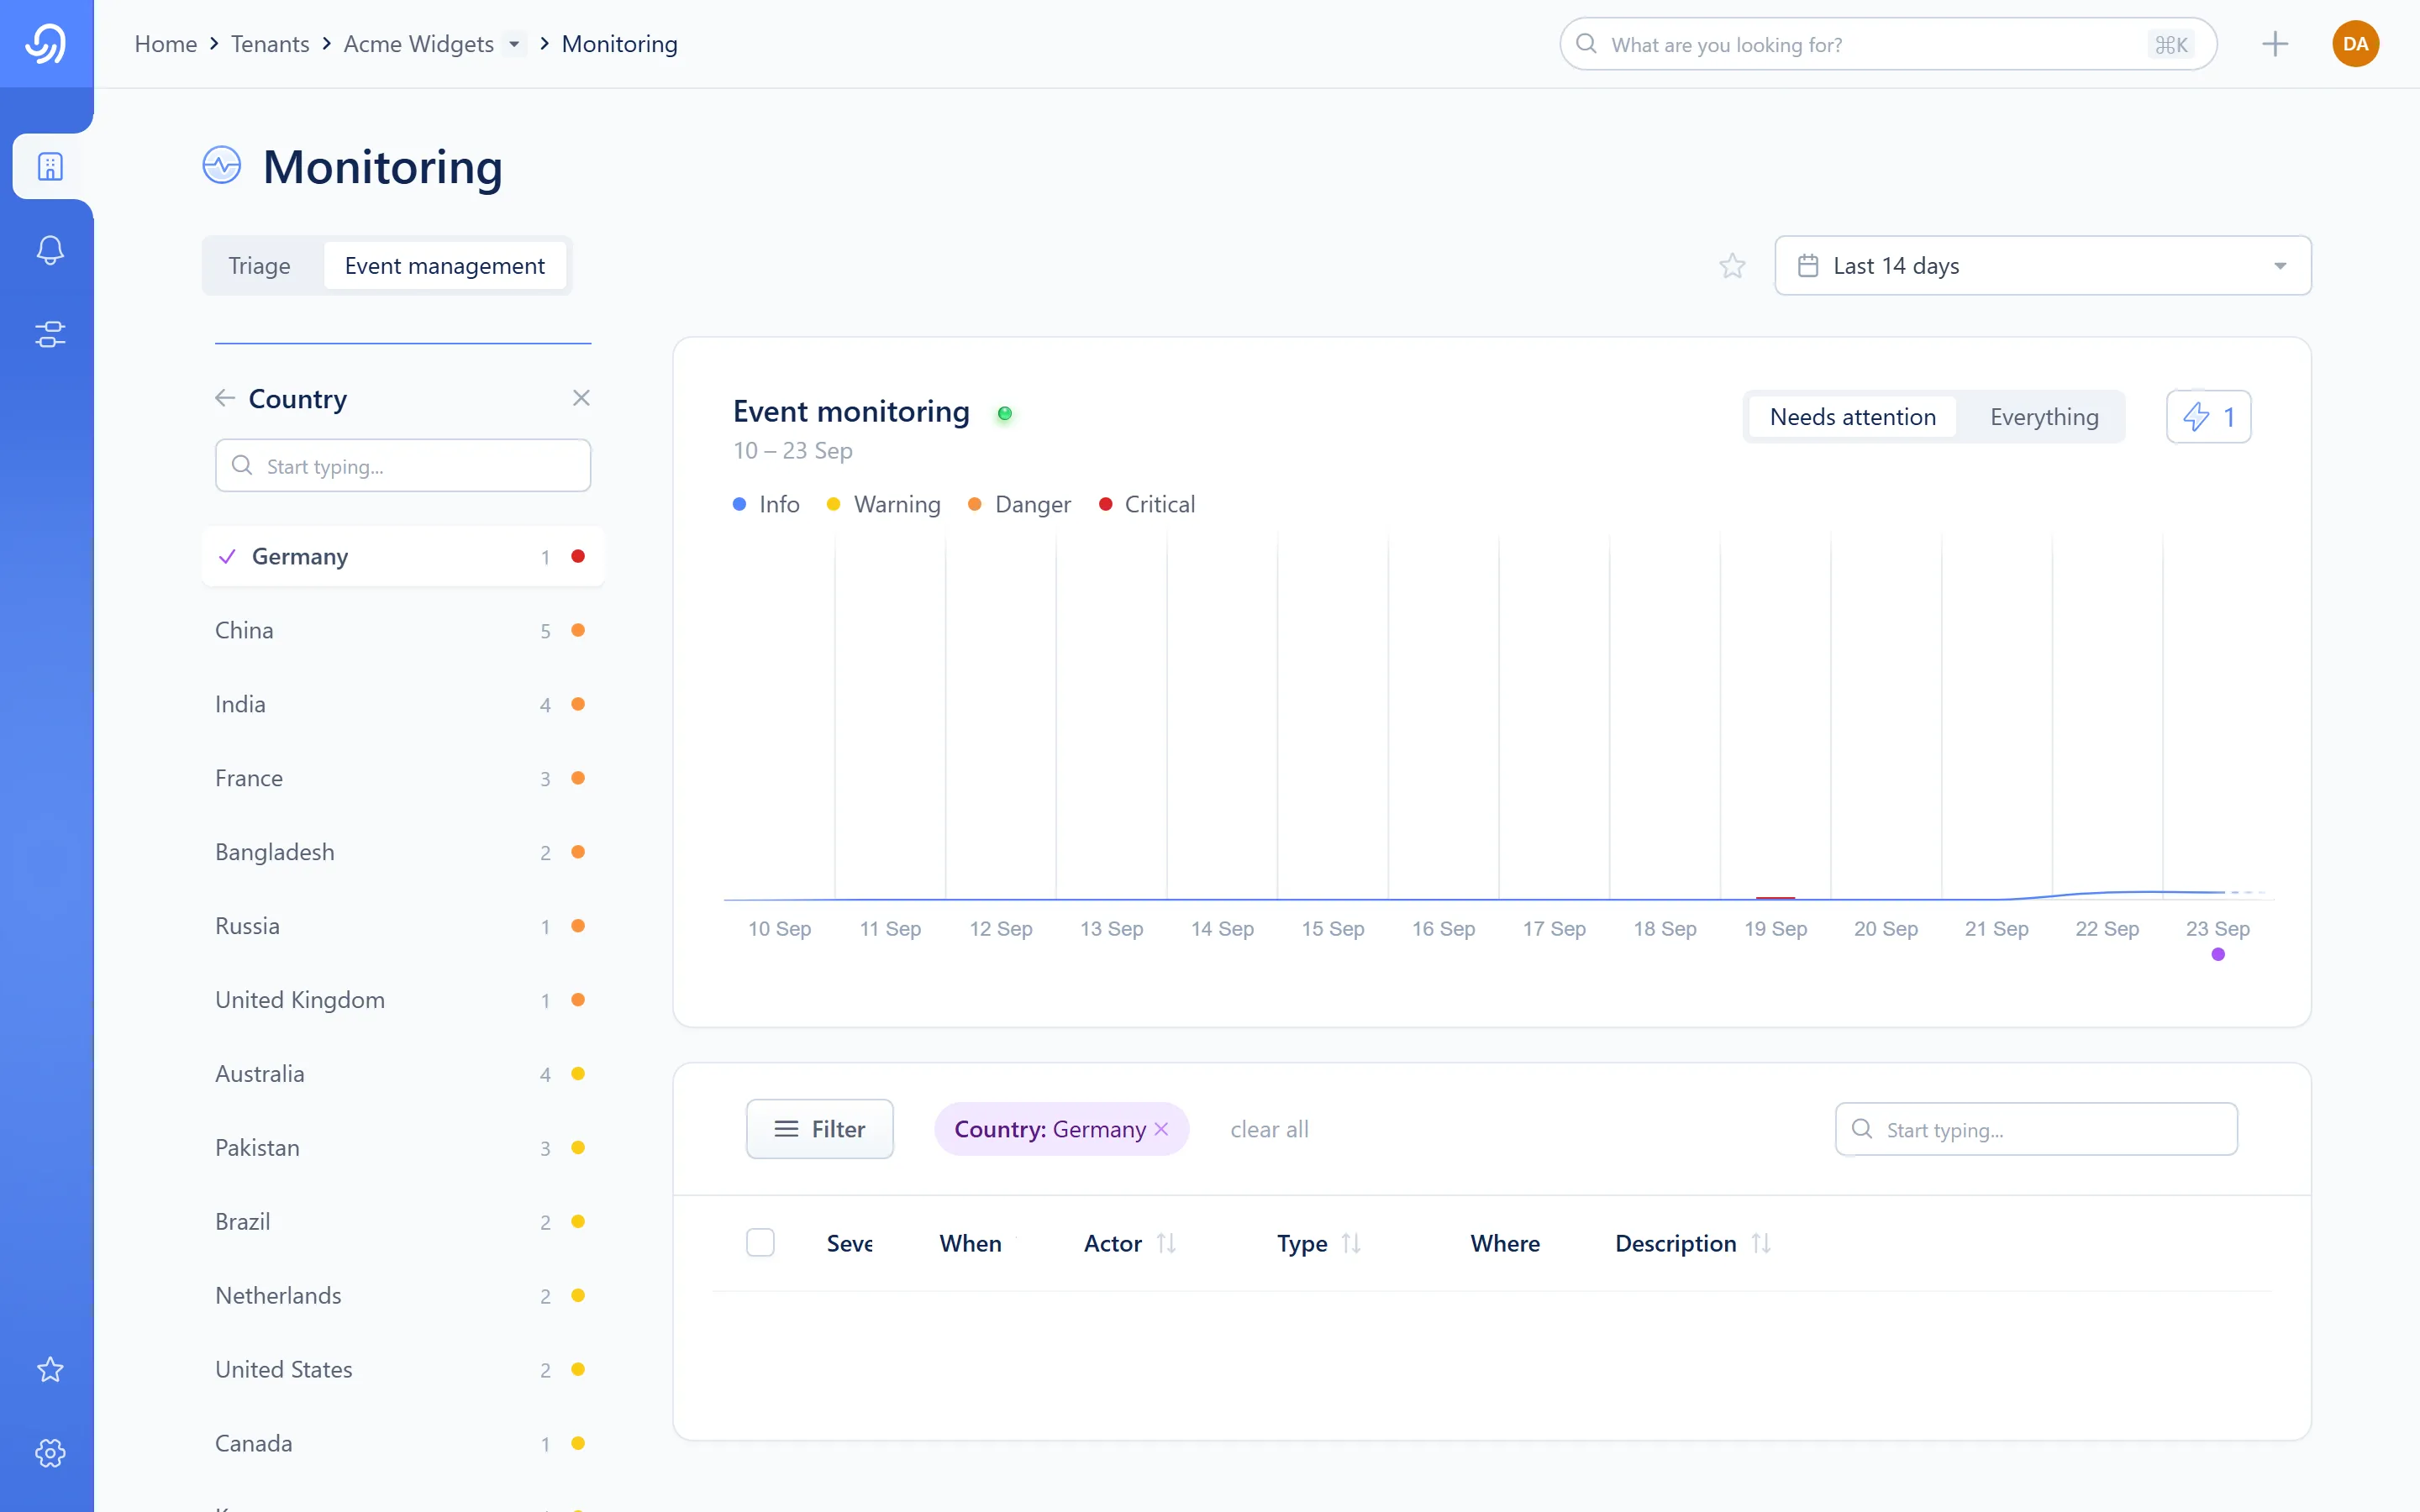
- Back to the category list
- The category’s values, each with a count
Select Add filter, or the Filter button once you have any chips, to open the drawer. It has two levels:
- The seven categories — Severity, Country, User, Region, IP, ASN and Type. Each shows how many values it has, and a badge if you’ve already picked something from it.
- One category’s values — select a category to see its values, each with how many events currently carry it. A free-text field narrows a long list. Values you pick appear as chips above the table; the drawer stays open, because picking several values at once from several categories is the normal case.
Values within a category are OR’d together and different categories are AND’d: picking two countries widens the results, while picking a country and a user narrows them. Clear all removes every chip without closing the drawer.
If a category’s list is capped, the drawer says so at the bottom of the value list (for example, “Showing the 200 most significant of 1,432 values, worst severity first”).
Event detail
Section titled “Event detail”Selecting a row opens the event in a side sheet.
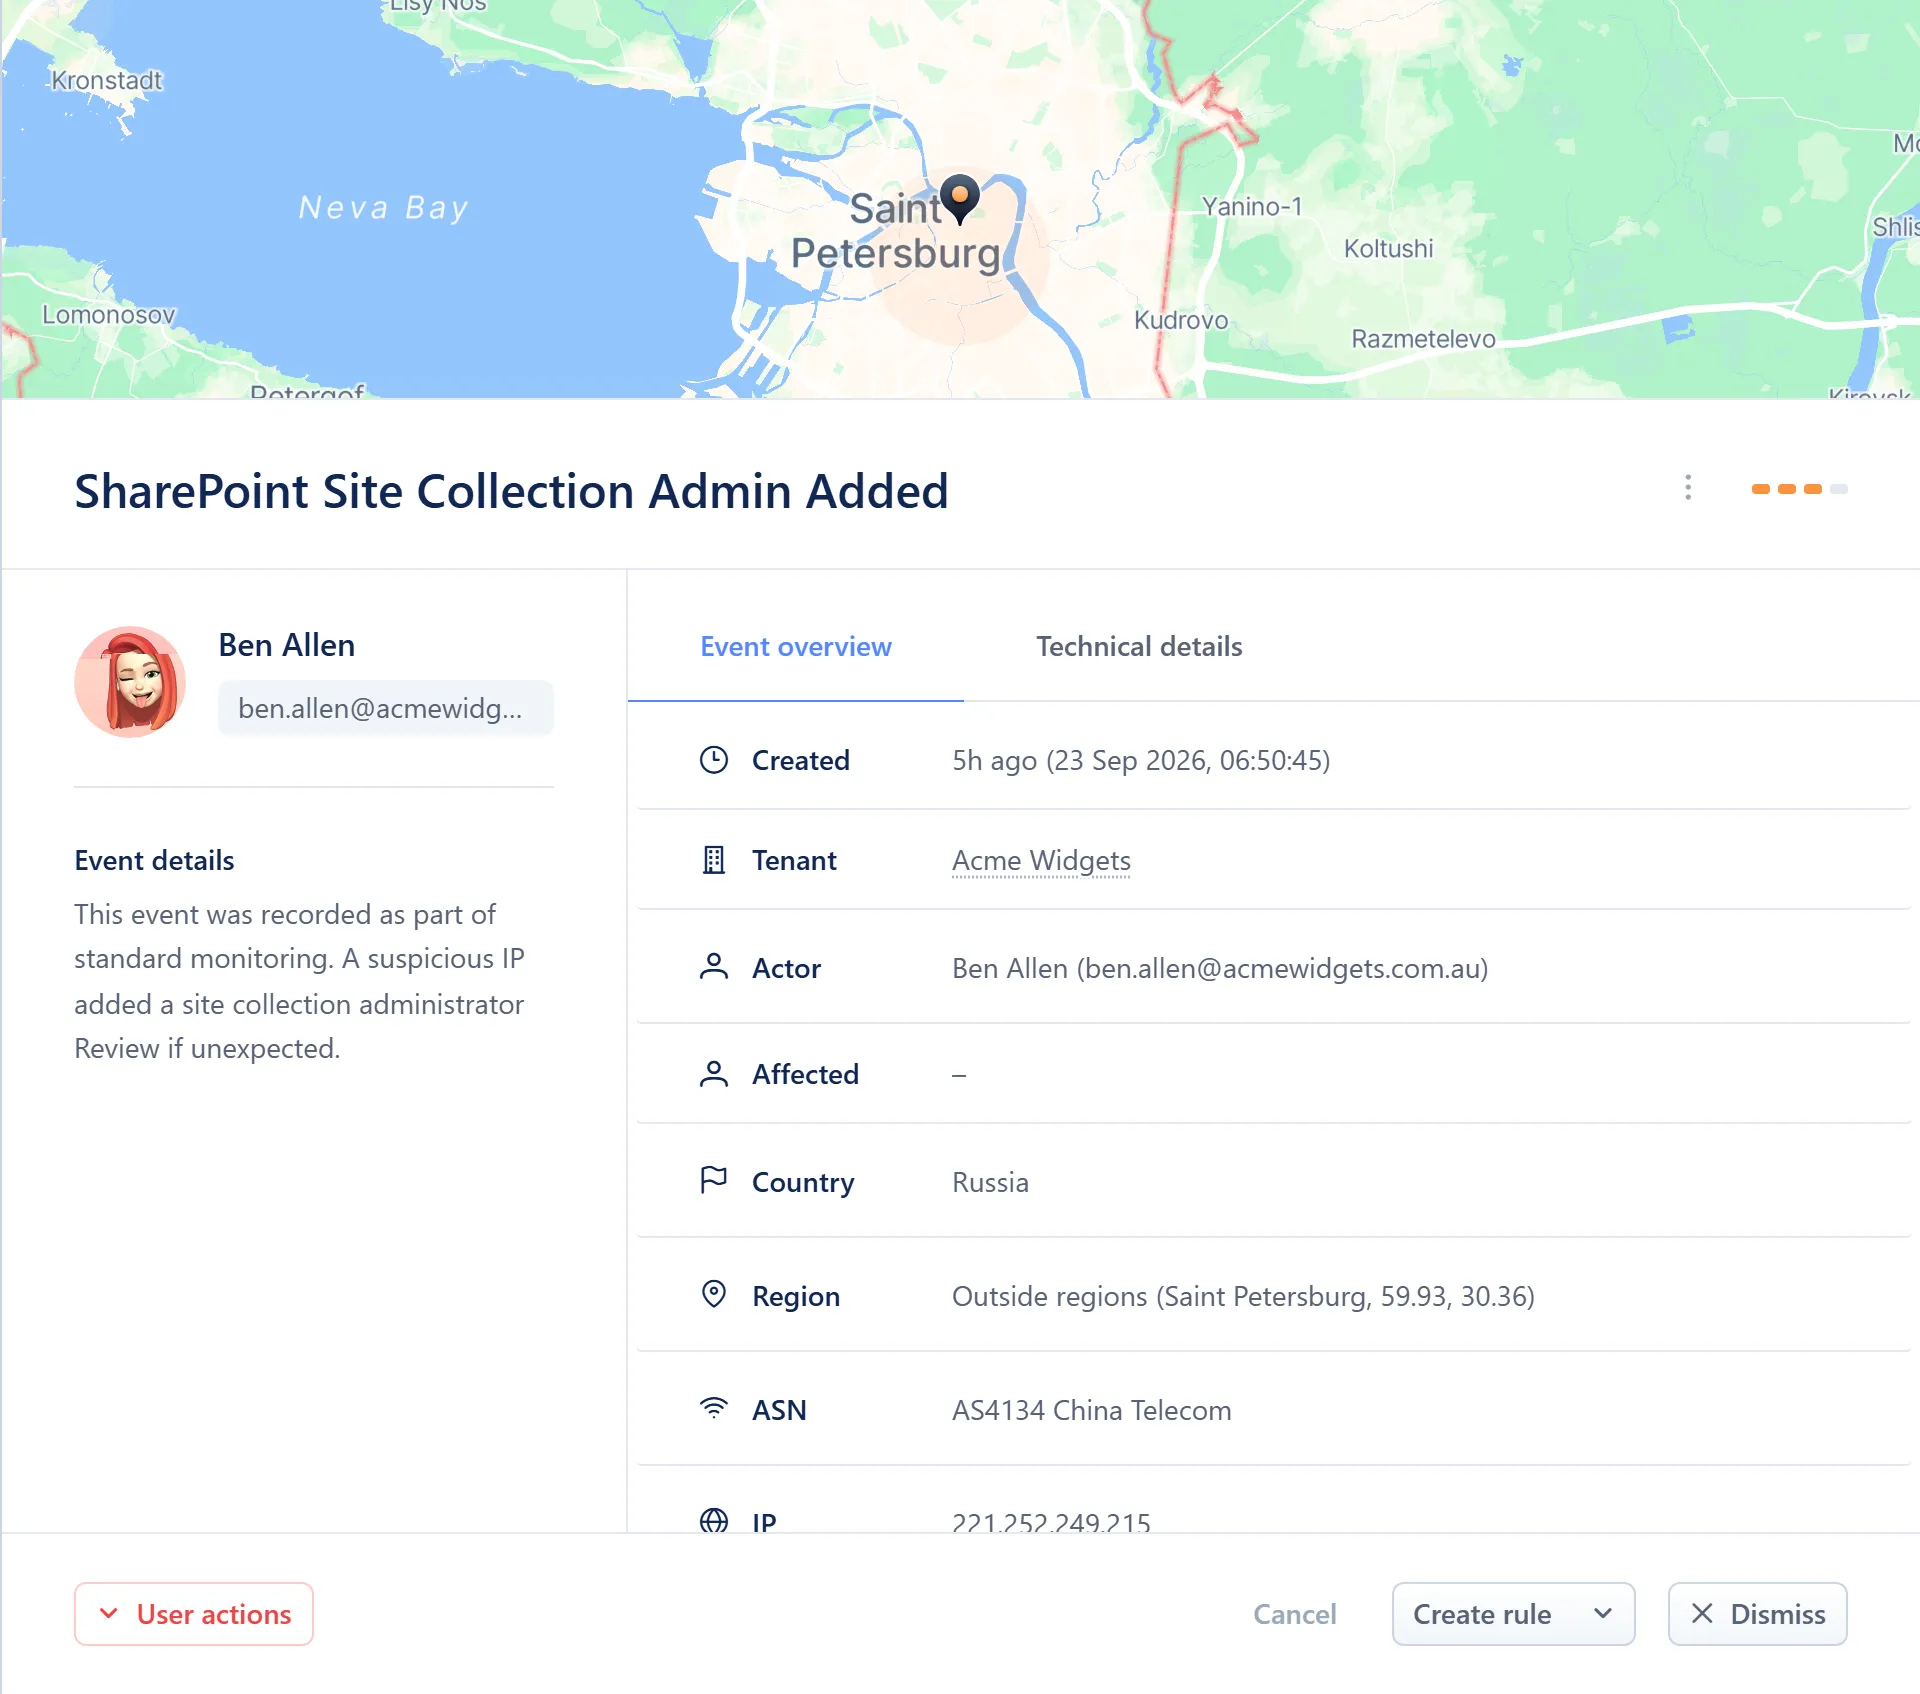
- Location map, with a pin at the resolved sign-in location
- Actor, Country, Region, ASN, IP and Sign-in rows
- Event overview · Technical details · History tabs
Each of Actor, Country, Region, ASN (network operator) and IP has its own menu:
- Filter events by X — re-runs the search restricted to that value.
- Country rule, Region rule, ASN rule or IP rule (not offered for Actor) — opens the rule dialog with that condition already filled in. See Event rules.
If a rule graded this event on arrival, or suppressed a duplicate of it, the sheet says so above the detail.
Actions
Section titled “Actions”| Action | What it does | Minimum role |
|---|---|---|
| Dismiss | Removes the event from Needs attention (or dims it in place under Everything) | L2 Support |
| Create rule | Opens the rule dialog, pre-filled from this event, to stop or re-grade events like it in future | L2 Support |
| Block user | Disables the actor’s account and ends its sessions | L1 Read/Write |
| Reset password | Issues the actor a new password | L1 Read/Write |
Block user and Reset password aren’t offered for an actor that isn’t a real person (a shared mailbox, for example) or where the action doesn’t apply.